 OLAP
Control
OLAP
Control
OLAP
ControlSee also: Service Reports, OLAP Control Right Click Menu, Field Settings dialog box
OLAP is a powerful multi-dimensional analysis tool that enables users to manipulate and filter the data they want to see and then save the report as a preset favorite.
The OLAP Control area is divided into two sections:
Fields - Displays list of all the fields, that appear in Raw Data grid
Filters - You can drag and drop appropriate fields from the Field section into appropriate area of Filter section, in order to filter the data in the grid
You can drag appropriate field from Field section and drop it into appropriate area of the Filter section of the OLAP control. Accordingly, the data is filtered and loaded into the Raw Data grid. Based on the data populated in the Raw Data grid, reports can be viewed in Graph, Map, Gantt and Cross-Tab style.
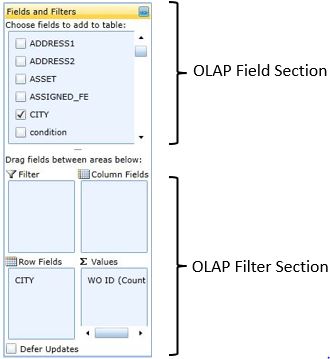
Figure: OLAP Control
 Service
Reports-Ribbon
Service
Reports-Ribbon